Trust Pages
Customise a Board Report table, explore performance breakdowns and export data from each Trust's page.
1. Board Report
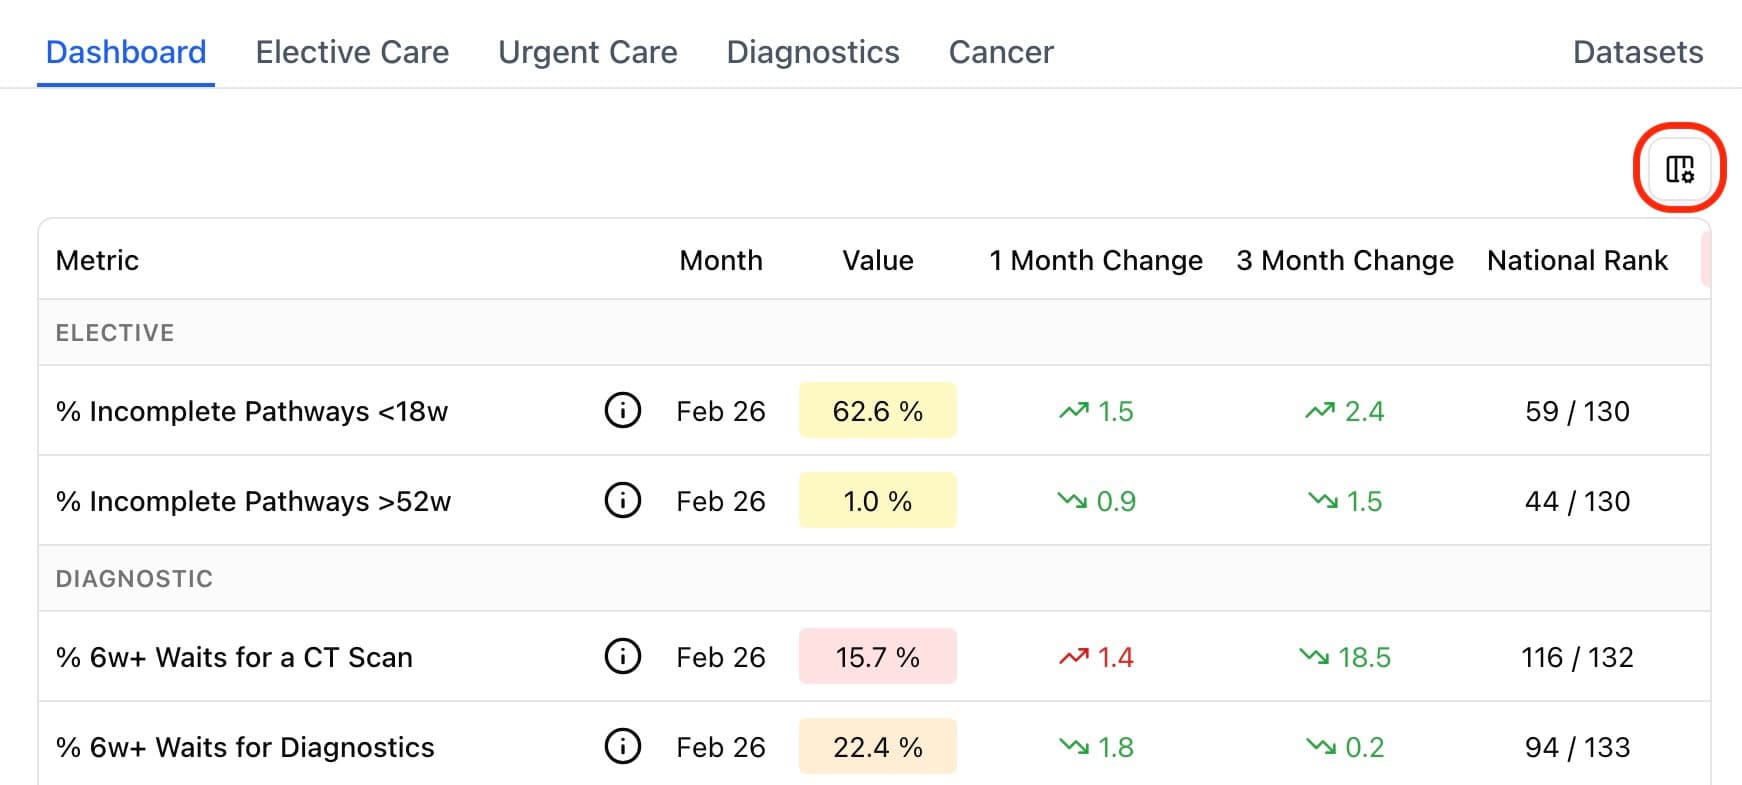
Edit the metrics that appear within the report by pressing the column button (circled in red above) which opens the sidebar shown below.
Editing
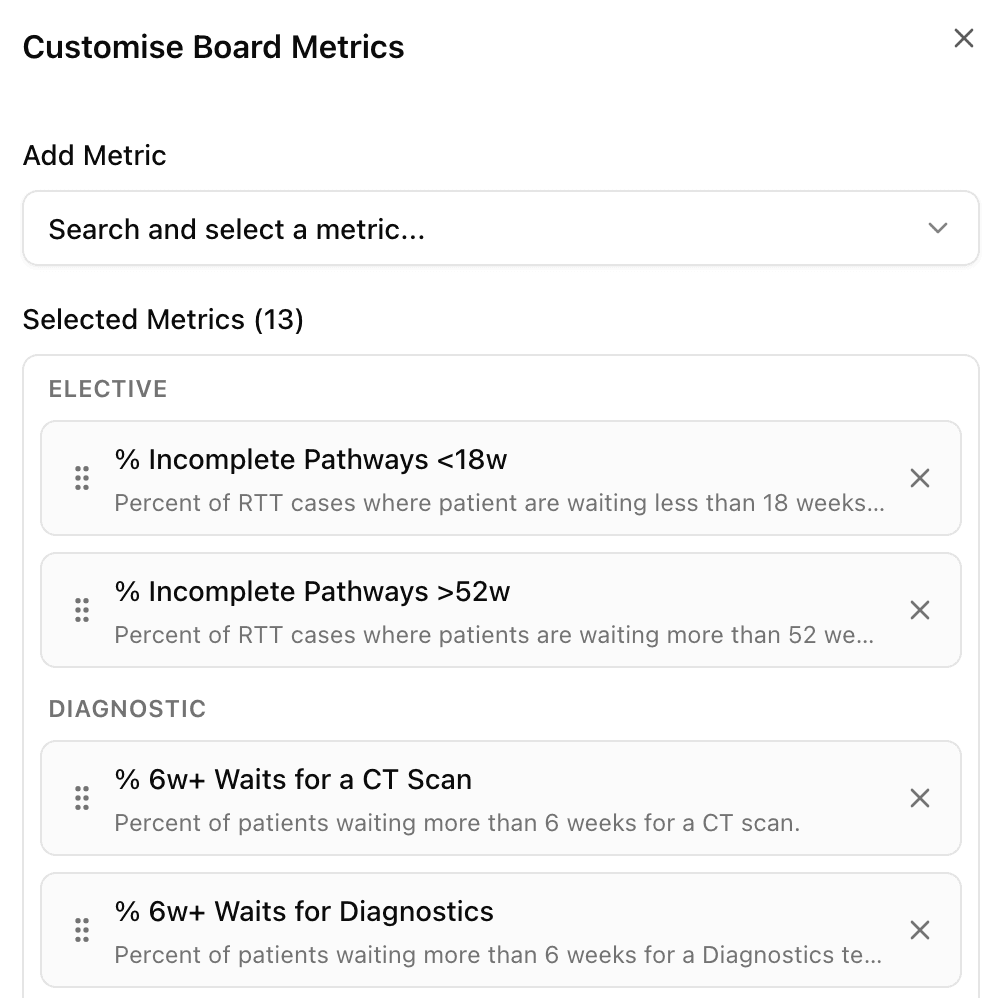
You can add metrics using the search at the top and reorder them by dragging them.
2. Performance Breakdowns
The Elective Care, Urgent Care, Diagnostics and Cancer tabs give the performance breakdowns across each service.
The breakdowns display performance by specialties, types or tests as applicable to each service. The Elective Care tab is shown below.
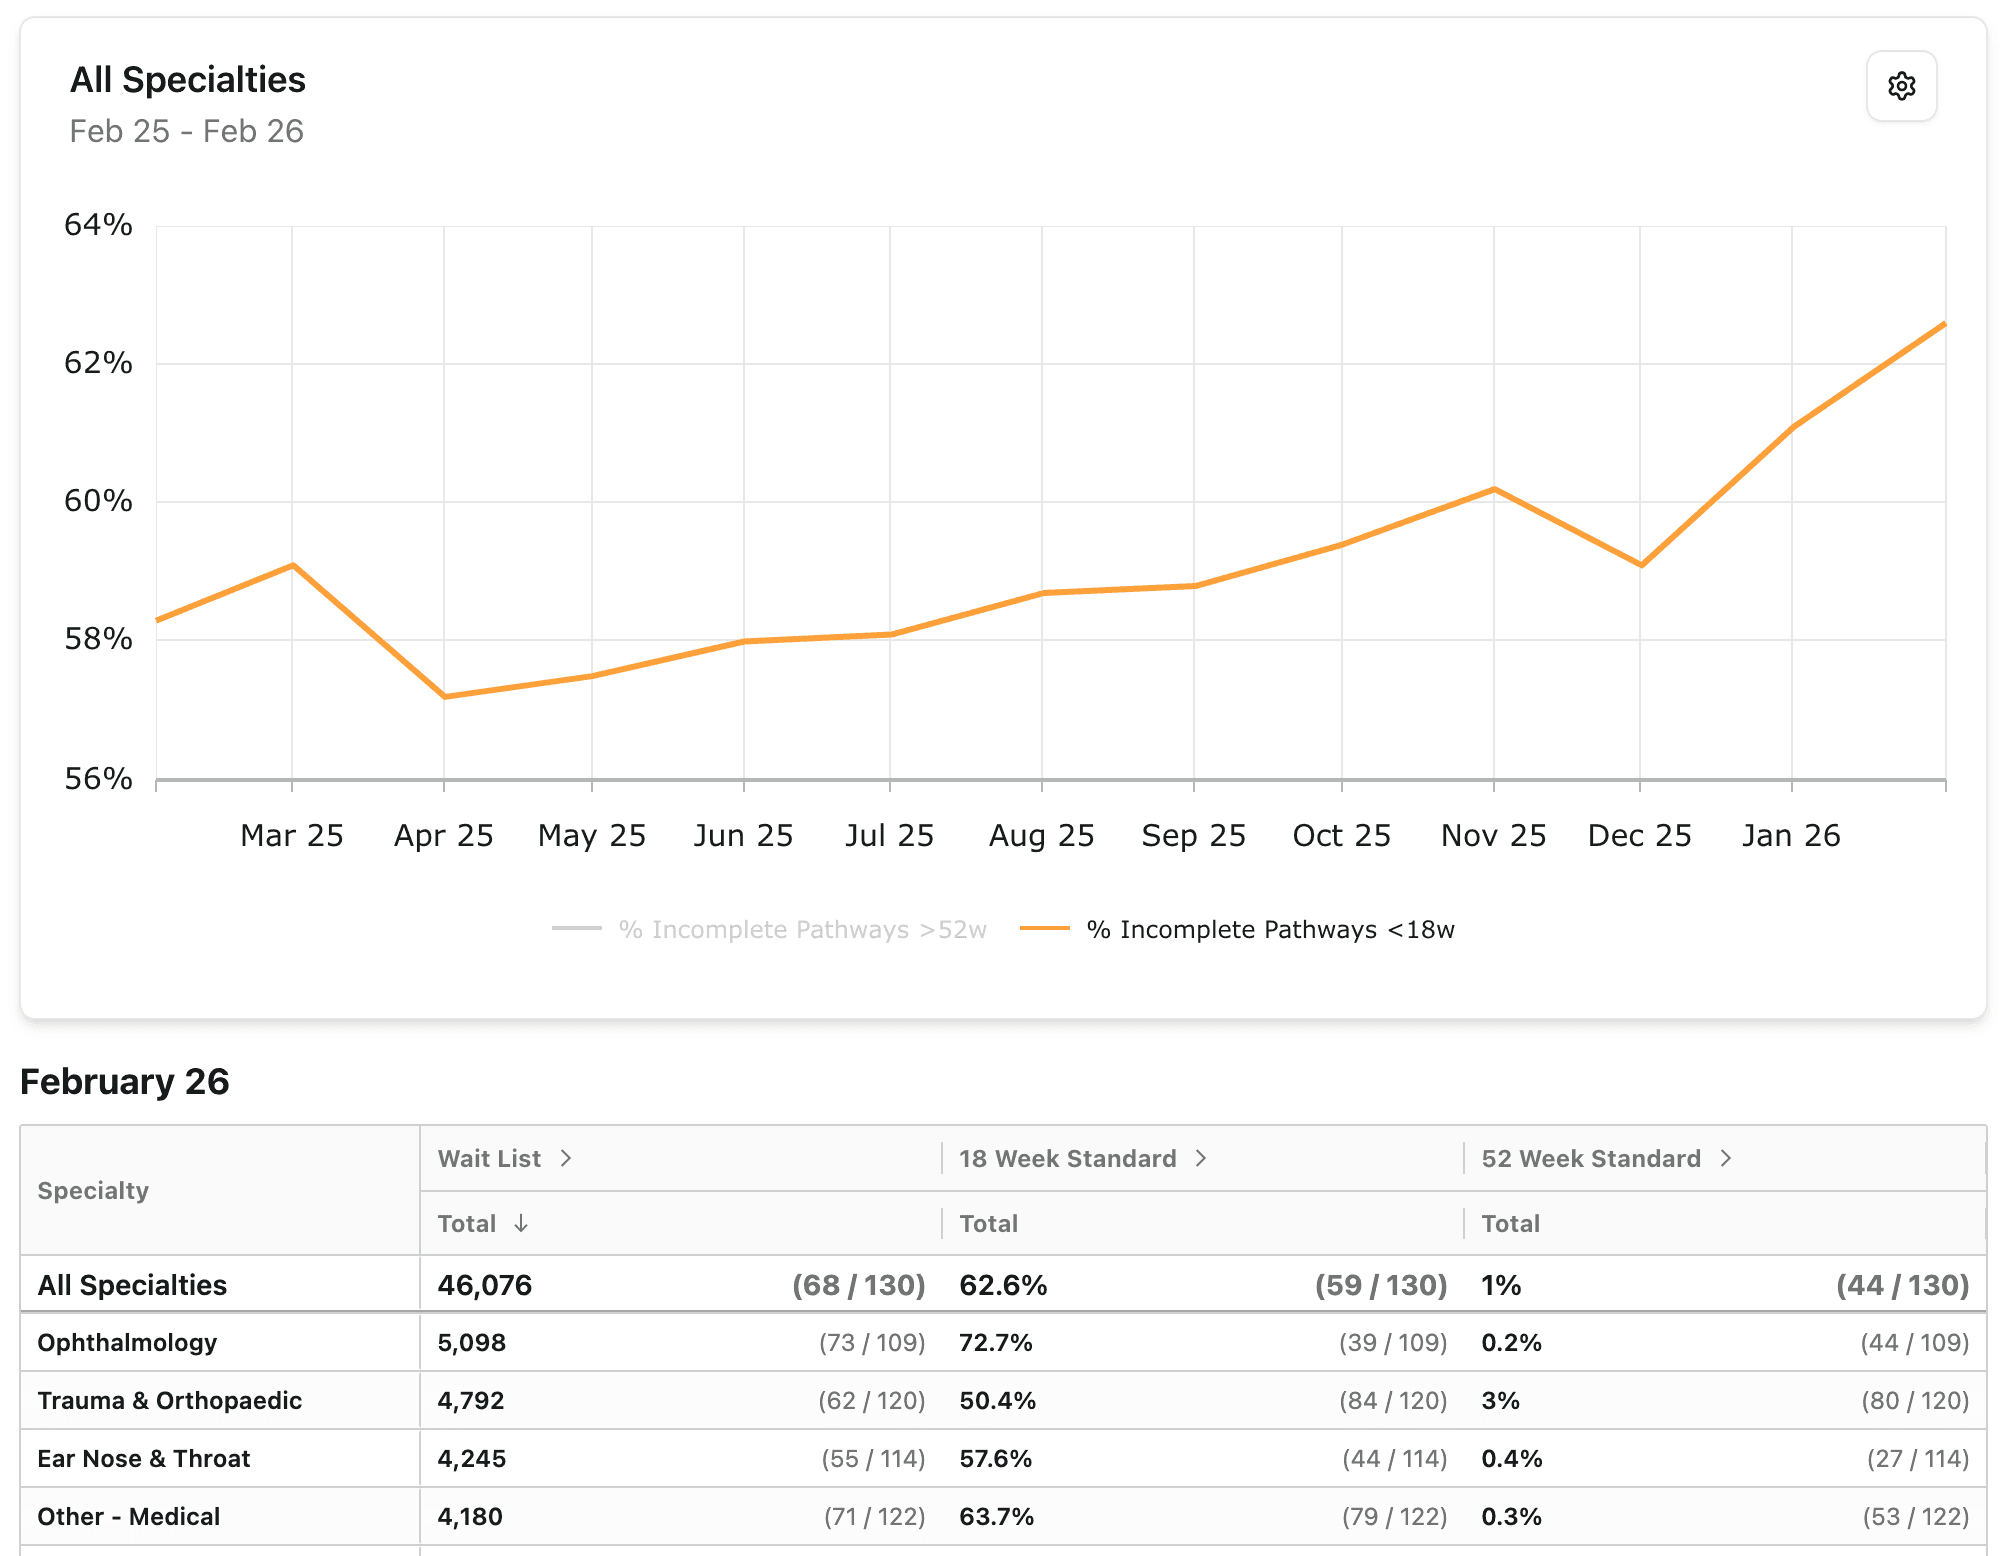
Click on a row to have the graph show the time-series data for that specialty/test etc.
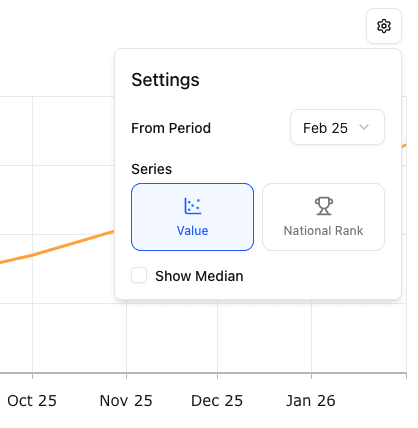
Graph Settings
You can adjust how far back the data is shown, along with swapping to see national rank or adding a median performance comparison.
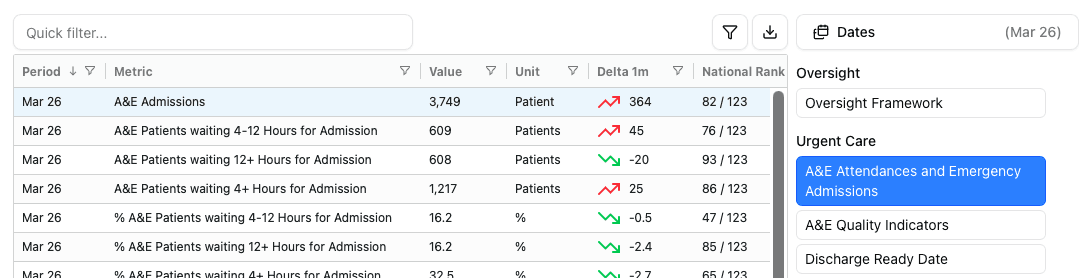
3. Datasets
For analyst plans you have access to the dataset tab to export all data for use in your own reporting / analysis.
You can select the dataset and adjust the dates to extract data for. To find out more information about the metrics, use the catalogue.