Unrecorded removals only made up 32% of the rise in total removals
With the release of March RTT data, there have been a lot of articles drawing attention to unrecorded removals. This may have left you wondering:
- Where this figure comes from?
- How did it impact recent performance gains?
1. Where does the figure come from?
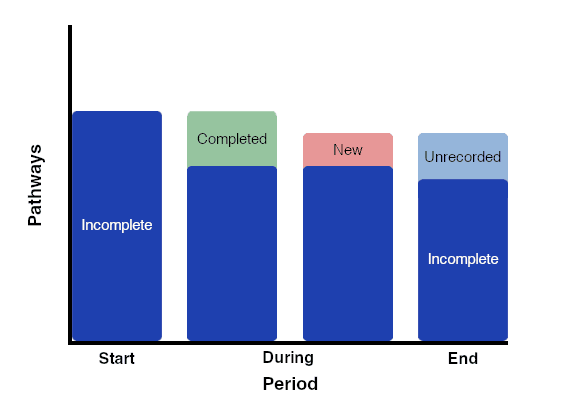
The monthly RTT data includes figures for the number of Incomplete pathways, Completed Pathways and New Pathways.
If you took 2 months of data, and set:
incomplete pathways at start = Incomplete Pathways from the 1st month
incomplete pathways at end = Incomplete Pathways from the 2nd month
completed pathways = Completed Pathways in the 2nd month
new pathways = New Pathways in the 2nd month
You may expect this equation to work:
incomplete pathways at end = incomplete pathways at start - completed pathways + new pathways

However, in practice there is a mismatch that is solved with unrecorded removals as a balancing force:
incomplete pathways at end = incomplete pathways at start - completed pathways + new pathways +/- unrecorded removals
There are many reasons for removals being unrecorded including when the data is submitted, for more information refer to the word document written by the NHS linked in the summary section.
N.B Whilst they have been labelled "unrecorded removals", it is possible that there will be extra pathways added on rather than taken off. These "unrecorded additions" are shown as negative values for "unrecorded removals".
2. How it impacted recent performance gains?
March 2026 saw 17.1% of the total removals come from "unrecorded removals", an increase of 90,282 from Feb which has been stated in headlines as the main driver behind recent wait list improvements.
However, in the same Excel File March saw an increase of 194,777 completed pathways from Feb. So the increase in unrecorded removals actually accounts for just under 1/3 of the monthly increase in removed pathways.
Beyond just a wait list reduction the implication is that it influenced the performance improvement in the 18 week standard, helping reach the 65% target.
But looking at Feb-Mar 2026 data, the correlation between the % of unrecorded removals and the 18 week performance change across Acute Trusts was 0.07, which is classified as a weak/non-existent correlation.
East Cheshire, the Trust with the highest % of unrecorded removals achieved a 2.0% improvement in their 18 week performance. Whereas East Kent, the Trust with the lowest % of unrecorded removals (highest % of unrecorded additions) achieved a 5.2% improvement in their 18 week performance.
| Acute Trust | Total Removals | URs | % URs | % < 18w Change |
|---|---|---|---|---|
| East Cheshire NHS Trust | 6,790 | 4,390 | 64.7% | 2.0% |
| East Kent Hospitals University NHS Foundation Trust | 13,674 | -6,660 | -48.7% | 5.2% |
UR = Unrecorded Removals Data for all Acute Trusts is shown below at the bottom
3. Summary
Unrecorded removals did rise to 17.1% of all removals in March, but as long as the removals were within the criteria given to Trusts it is an expected practice and 17% was the monthly average pre Covid. In raw numbers this was a 90,282 increase in March which was less than half of the 194,777 increase in completed pathways.
Whilst there is understandable interest and critique of how improvements are being made and whether they can be sustained. The recent headlines have done a disservice to the Trusts and their teams who are making a difference to the care provided to patients not only in the past month but over the past year.
Data for Acute Trusts across Feb 2026 and March 2026
| Acute Trust | Total Removals | URs | % URs | % < 18w Change |
|---|---|---|---|---|
| East Cheshire NHS Trust | 6,790 | 4,390 | 64.7% | 2.0% |
| Royal Berkshire NHS Foundation Trust | 10,848 | 6,415 | 59.1% | 1.6% |
| The Queen Elizabeth Hospital, King's Lynn, NHS Foundation Trust | 6,340 | 3,231 | 51.0% | 4.4% |
| Nottingham University Hospitals NHS Trust | 28,956 | 13,819 | 47.7% | 7.3% |
| Bedfordshire Hospitals NHS Foundation Trust | 21,700 | 9,689 | 44.6% | 1.5% |
| Milton Keynes University Hospital NHS Foundation Trust | 9,686 | 4,021 | 41.5% | 4.7% |
| Barking, Havering And Redbridge University Hospitals NHS Trust | 22,221 | 8,502 | 38.3% | 1.7% |
| The Walton Centre NHS Foundation Trust | 5,116 | 1,939 | 37.9% | 1.5% |
| Gloucestershire Hospitals NHS Foundation Trust | 20,429 | 7,080 | 34.7% | 2.8% |
| Blackpool Teaching Hospitals NHS Foundation Trust | 11,910 | 4,102 | 34.4% | 4.3% |
| Lancashire Teaching Hospitals NHS Foundation Trust | 12,510 | 4,238 | 33.9% | 3.7% |
| West Suffolk NHS Foundation Trust | 9,496 | 3,091 | 32.6% | 3.1% |
| Mid Cheshire Hospitals NHS Foundation Trust | 13,416 | 4,190 | 31.2% | 5.2% |
| Royal Free London NHS Foundation Trust | 38,732 | 11,931 | 30.8% | 4.1% |
| York And Scarborough Teaching Hospitals NHS Foundation Trust | 18,154 | 5,119 | 28.2% | 1.9% |
| Barts Health NHS Trust | 35,320 | 9,788 | 27.7% | 3.5% |
| George Eliot Hospital NHS Trust | 6,023 | 1,650 | 27.4% | 2.6% |
| London North West University Healthcare NHS Trust | 20,141 | 5,502 | 27.3% | 2.3% |
| Mid And South Essex NHS Foundation Trust | 39,199 | 10,658 | 27.2% | 0.2% |
| Chelsea And Westminster Hospital NHS Foundation Trust | 16,860 | 4,405 | 26.1% | 2.5% |
| Homerton Healthcare NHS Foundation Trust | 9,109 | 2,377 | 26.1% | 2.9% |
| Royal United Hospitals Bath NHS Foundation Trust | 13,430 | 3,478 | 25.9% | 2.9% |
| East Sussex Healthcare NHS Trust | 16,997 | 4,363 | 25.7% | 2.6% |
| University Hospitals Coventry And Warwickshire NHS Trust | 15,752 | 4,048 | 25.7% | 1.4% |
| United Lincolnshire Hospitals NHS Trust | 16,677 | 4,215 | 25.3% | 4.5% |
| South Warwickshire University NHS Foundation Trust | 8,339 | 2,106 | 25.3% | 2.2% |
| Warrington And Halton Teaching Hospitals NHS Foundation Trust | 9,923 | 2,482 | 25.0% | 2.3% |
| Northumbria Healthcare NHS Foundation Trust | 9,408 | 2,355 | 25.0% | 1.2% |
| East Lancashire Hospitals NHS Trust | 17,417 | 4,220 | 24.2% | 5.2% |
| Liverpool University Hospitals NHS Foundation Trust | 18,631 | 4,451 | 23.9% | 4.5% |
| Portsmouth Hospitals University NHS Trust | 18,087 | 4,298 | 23.8% | 4.0% |
| Kingston Hospital NHS Foundation Trust | 13,368 | 3,173 | 23.7% | 7.9% |
| The Royal Wolverhampton NHS Trust | 21,278 | 4,929 | 23.2% | 3.5% |
| Wrightington, Wigan And Leigh NHS Foundation Trust | 11,382 | 2,635 | 23.2% | 2.2% |
| Sherwood Forest Hospitals NHS Foundation Trust | 9,264 | 2,100 | 22.7% | 2.7% |
| Countess Of Chester Hospital NHS Foundation Trust | 10,384 | 2,334 | 22.5% | 5.9% |
| Croydon Health Services NHS Trust | 12,713 | 2,861 | 22.5% | 4.6% |
| Ashford And St Peter's Hospitals NHS Foundation Trust | 13,705 | 3,054 | 22.3% | 1.3% |
| University Hospitals Dorset NHS Foundation Trust | 20,635 | 4,607 | 22.3% | 3.7% |
| Epsom And St Helier University Hospitals NHS Trust | 16,944 | 3,743 | 22.1% | 3.2% |
| Manchester University NHS Foundation Trust | 46,540 | 10,208 | 21.9% | 3.0% |
| North West Anglia NHS Foundation Trust | 18,035 | 3,953 | 21.9% | 1.9% |
| Gateshead Health NHS Foundation Trust | 5,067 | 1,084 | 21.4% | 5.9% |
| University Hospitals Of Morecambe Bay NHS Foundation Trust | 11,817 | 2,488 | 21.1% | 4.3% |
| Bolton NHS Foundation Trust | 8,686 | 1,837 | 21.1% | 2.3% |
| East Suffolk And North Essex NHS Foundation Trust | 21,692 | 4,565 | 21.0% | 3.0% |
| Royal National Orthopaedic Hospital NHS Trust | 2,717 | 571 | 21.0% | 0.4% |
| The Newcastle Upon Tyne Hospitals NHS Foundation Trust | 29,831 | 6,270 | 21.0% | 1.5% |
| Great Western Hospitals NHS Foundation Trust | 10,434 | 2,177 | 20.9% | 0.4% |
| Northampton General Hospital NHS Trust | 11,734 | 2,446 | 20.8% | 1.2% |
| Kettering General Hospital NHS Foundation Trust | 8,191 | 1,679 | 20.5% | 1.8% |
| Liverpool Women's NHS Foundation Trust | 4,603 | 911 | 19.8% | 9.2% |
| Northern Care Alliance NHS Foundation Trust | 29,115 | 5,728 | 19.7% | 4.7% |
| Lewisham And Greenwich NHS Trust | 12,793 | 2,462 | 19.2% | 2.9% |
| Leeds Teaching Hospitals NHS Trust | 27,292 | 5,098 | 18.7% | 1.3% |
| Wirral University Teaching Hospital NHS Foundation Trust | 14,424 | 2,657 | 18.4% | 5.0% |
| University Hospitals Of Derby And Burton NHS Foundation Trust | 28,430 | 5,214 | 18.3% | 4.5% |
| East And North Hertfordshire NHS Trust | 13,369 | 2,415 | 18.1% | 1.3% |
| Somerset NHS Foundation Trust | 15,614 | 2,828 | 18.1% | 2.3% |
| Liverpool Heart And Chest Hospital NHS Foundation Trust | 1,747 | 314 | 18.0% | 1.3% |
| Royal Cornwall Hospitals NHS Trust | 14,684 | 2,583 | 17.6% | 1.4% |
| Torbay And South Devon NHS Foundation Trust | 10,477 | 1,849 | 17.6% | -0.4% |
| James Paget University Hospitals NHS Foundation Trust | 6,955 | 1,226 | 17.6% | 1.5% |
| University Hospitals Of Leicester NHS Trust | 28,418 | 4,976 | 17.5% | 3.4% |
| North Cumbria Integrated Care NHS Foundation Trust | 11,479 | 2,010 | 17.5% | 6.5% |
| University Hospitals Birmingham NHS Foundation Trust | 32,187 | 5,548 | 17.2% | 6.1% |
| The Rotherham NHS Foundation Trust | 9,194 | 1,565 | 17.0% | 1.6% |
| Stockport NHS Foundation Trust | 8,957 | 1,449 | 16.2% | 2.0% |
| Royal Surrey County Hospital NHS Foundation Trust | 7,005 | 1,120 | 16.0% | 2.5% |
| Guy's And St Thomas' NHS Foundation Trust | 33,510 | 5,281 | 15.8% | 1.2% |
| Chesterfield Royal Hospital NHS Foundation Trust | 7,767 | 1,219 | 15.7% | 4.5% |
| Harrogate And District NHS Foundation Trust | 5,939 | 923 | 15.5% | 1.6% |
| Surrey And Sussex Healthcare NHS Trust | 12,741 | 1,919 | 15.1% | 2.0% |
| University College London Hospitals NHS Foundation Trust | 19,446 | 2,937 | 15.1% | 1.4% |
| Imperial College Healthcare NHS Trust | 28,795 | 4,168 | 14.5% | 2.3% |
| Mid Yorkshire Hospitals NHS Trust | 17,005 | 2,443 | 14.4% | 2.9% |
| Whittington Health NHS Trust | 11,250 | 1,598 | 14.2% | 9.9% |
| North Bristol NHS Trust | 14,992 | 2,114 | 14.1% | 2.8% |
| Cambridge University Hospitals NHS Foundation Trust | 18,844 | 2,621 | 13.9% | 2.1% |
| Royal Devon University Healthcare NHS Foundation Trust | 19,641 | 2,683 | 13.7% | 0.7% |
| The Hillingdon Hospitals NHS Foundation Trust | 8,393 | 1,133 | 13.5% | 2.5% |
| Oxford University Hospitals NHS Foundation Trust | 21,677 | 2,930 | 13.5% | 2.4% |
| King's College Hospital NHS Foundation Trust | 23,937 | 3,138 | 13.1% | 2.1% |
| South Tees Hospitals NHS Foundation Trust | 16,524 | 2,170 | 13.1% | 2.2% |
| Dartford And Gravesham NHS Trust | 9,502 | 1,211 | 12.7% | 2.3% |
| Buckinghamshire Healthcare NHS Trust | 11,749 | 1,490 | 12.7% | 3.0% |
| The Dudley Group NHS Foundation Trust | 12,916 | 1,627 | 12.6% | 3.1% |
| St George's University Hospitals NHS Foundation Trust | 17,726 | 2,226 | 12.6% | 1.2% |
| South Tyneside And Sunderland NHS Foundation Trust | 20,865 | 2,534 | 12.1% | 1.6% |
| Airedale NHS Foundation Trust | 5,120 | 619 | 12.1% | 0.8% |
| University Hospitals Sussex NHS Foundation Trust | 26,138 | 3,079 | 11.8% | 2.9% |
| Walsall Healthcare NHS Trust | 11,260 | 1,314 | 11.7% | 2.4% |
| Doncaster And Bassetlaw Teaching Hospitals NHS Foundation Trust | 13,550 | 1,498 | 11.1% | 1.8% |
| University Hospital Southampton NHS Foundation Trust | 19,841 | 2,186 | 11.0% | 2.5% |
| University Hospitals Of North Midlands NHS Trust | 18,921 | 2,058 | 10.9% | 3.0% |
| Wye Valley NHS Trust | 5,912 | 625 | 10.6% | 1.8% |
| Bradford Teaching Hospitals NHS Foundation Trust | 8,690 | 922 | 10.6% | 1.7% |
| Birmingham Women's And Children's NHS Foundation Trust | 5,026 | 533 | 10.6% | 3.3% |
| Northern Lincolnshire And Goole NHS Foundation Trust | 10,076 | 910 | 9.0% | 2.1% |
| Dorset County Hospital NHS Foundation Trust | 5,404 | 457 | 8.5% | 1.7% |
| University Hospitals Plymouth NHS Trust | 17,271 | 1,394 | 8.1% | 3.0% |
| West Hertfordshire Teaching Hospitals NHS Trust | 9,723 | 768 | 7.9% | 1.8% |
| Worcestershire Acute Hospitals NHS Trust | 15,161 | 1,146 | 7.6% | 3.9% |
| Salisbury NHS Foundation Trust | 8,044 | 587 | 7.3% | 1.3% |
| Tameside And Glossop Integrated Care NHS Foundation Trust | 5,618 | 406 | 7.2% | 1.7% |
| Medway NHS Foundation Trust | 9,435 | 617 | 6.5% | 2.4% |
| The Royal Orthopaedic Hospital NHS Foundation Trust | 3,356 | 215 | 6.4% | 2.4% |
| Barnsley Hospital NHS Foundation Trust | 7,438 | 429 | 5.8% | 2.9% |
| Norfolk And Norwich University Hospitals NHS Foundation Trust | 16,631 | 910 | 5.5% | 1.7% |
| Mersey And West Lancashire Teaching Hospitals NHS Trust | 19,698 | 744 | 3.8% | 3.1% |
| Hampshire Hospitals NHS Foundation Trust | 19,252 | 640 | 3.3% | 5.5% |
| Royal Papworth Hospital NHS Foundation Trust | 1,818 | 54 | 3.0% | 3.1% |
| Sheffield Children's NHS Foundation Trust | 4,367 | 132 | 3.0% | 3.2% |
| Frimley Health NHS Foundation Trust | 16,759 | 444 | 2.6% | 3.5% |
| Calderdale And Huddersfield NHS Foundation Trust | 10,084 | 159 | 1.6% | 1.2% |
| Alder Hey Children's NHS Foundation Trust | 4,385 | 54 | 1.2% | 4.9% |
| Maidstone And Tunbridge Wells NHS Trust | 17,559 | 95 | 0.5% | 5.5% |
| North Tees And Hartlepool NHS Foundation Trust | 8,681 | -87 | -1.0% | 0.4% |
| The Princess Alexandra Hospital NHS Trust | 10,065 | -161 | -1.6% | 6.3% |
| Sandwell And West Birmingham Hospitals NHS Trust | 17,222 | -314 | -1.8% | 4.6% |
| Moorfields Eye Hospital NHS Foundation Trust | 10,805 | -453 | -4.2% | 1.5% |
| Isle Of Wight NHS Trust | 3,620 | -169 | -4.7% | 2.1% |
| The Christie NHS Foundation Trust | 2,049 | -101 | -4.9% | 0.0% |
| Hull University Teaching Hospitals NHS Trust | 20,598 | -1,048 | -5.1% | 1.7% |
| Queen Victoria Hospital NHS Foundation Trust | 3,746 | -225 | -6.0% | 1.0% |
| University Hospitals Bristol And Weston NHS Foundation Trust | 12,245 | -965 | -7.9% | 0.5% |
| The Robert Jones And Agnes Hunt Orthopaedic Hospital NHS Foundation Trust | 4,289 | -508 | -11.8% | 6.0% |
| The Royal Marsden NHS Foundation Trust | 1,873 | -354 | -18.9% | 0.3% |
| County Durham And Darlington NHS Foundation Trust | 10,253 | -2,310 | -22.5% | 2.0% |
| Great Ormand Street Hospital for Children NHS Foundation Trust | 1,835 | -457 | -24.9% | 0.8% |
| The Clatterbridge Cancer Centre NHS Foundation Trust | 459 | -155 | -33.8% | 0.8% |
| The Shrewsbury And Telford Hospital NHS Trust | 8,520 | -3,151 | -37.0% | 5.8% |
| East Kent Hospitals University NHS Foundation Trust | 13,674 | -6,660 | -48.7% | 5.2% |