Elective CareRisers and Fallers1 Month
RTT 52 Week Performance - Feb 2026
Benji
Percent of RTT cases where patients are waiting more than 52 weeks to start treatment at the end of the month.
Feb 2026
Average: 1.5%
One Month Changes
| Average | │ | Trusts Improved | Trusts Maintained | Trusts Declined |
|---|---|---|---|---|
| -0.2% | │ | 80 | 35 | 18 |
*A decrease is an improvement
Regional Averages
| Region | Feb 2026 Acute Trust Avg | 1 Month Change |
|---|---|---|
| London | 1.12 % | -0.14 |
| North East and Yorkshire | 1.17 % | -0.05 |
| South West | 1.25 % | -0.08 |
| Midlands | 1.47 % | -0.15 |
| North West | 1.68 % | -0.27 |
| South East | 1.75 % | -0.14 |
| East of England | 2.40 % | -0.39 |
*These are made by averaging performance for the Acute Trusts within each region, not aggregated by region.
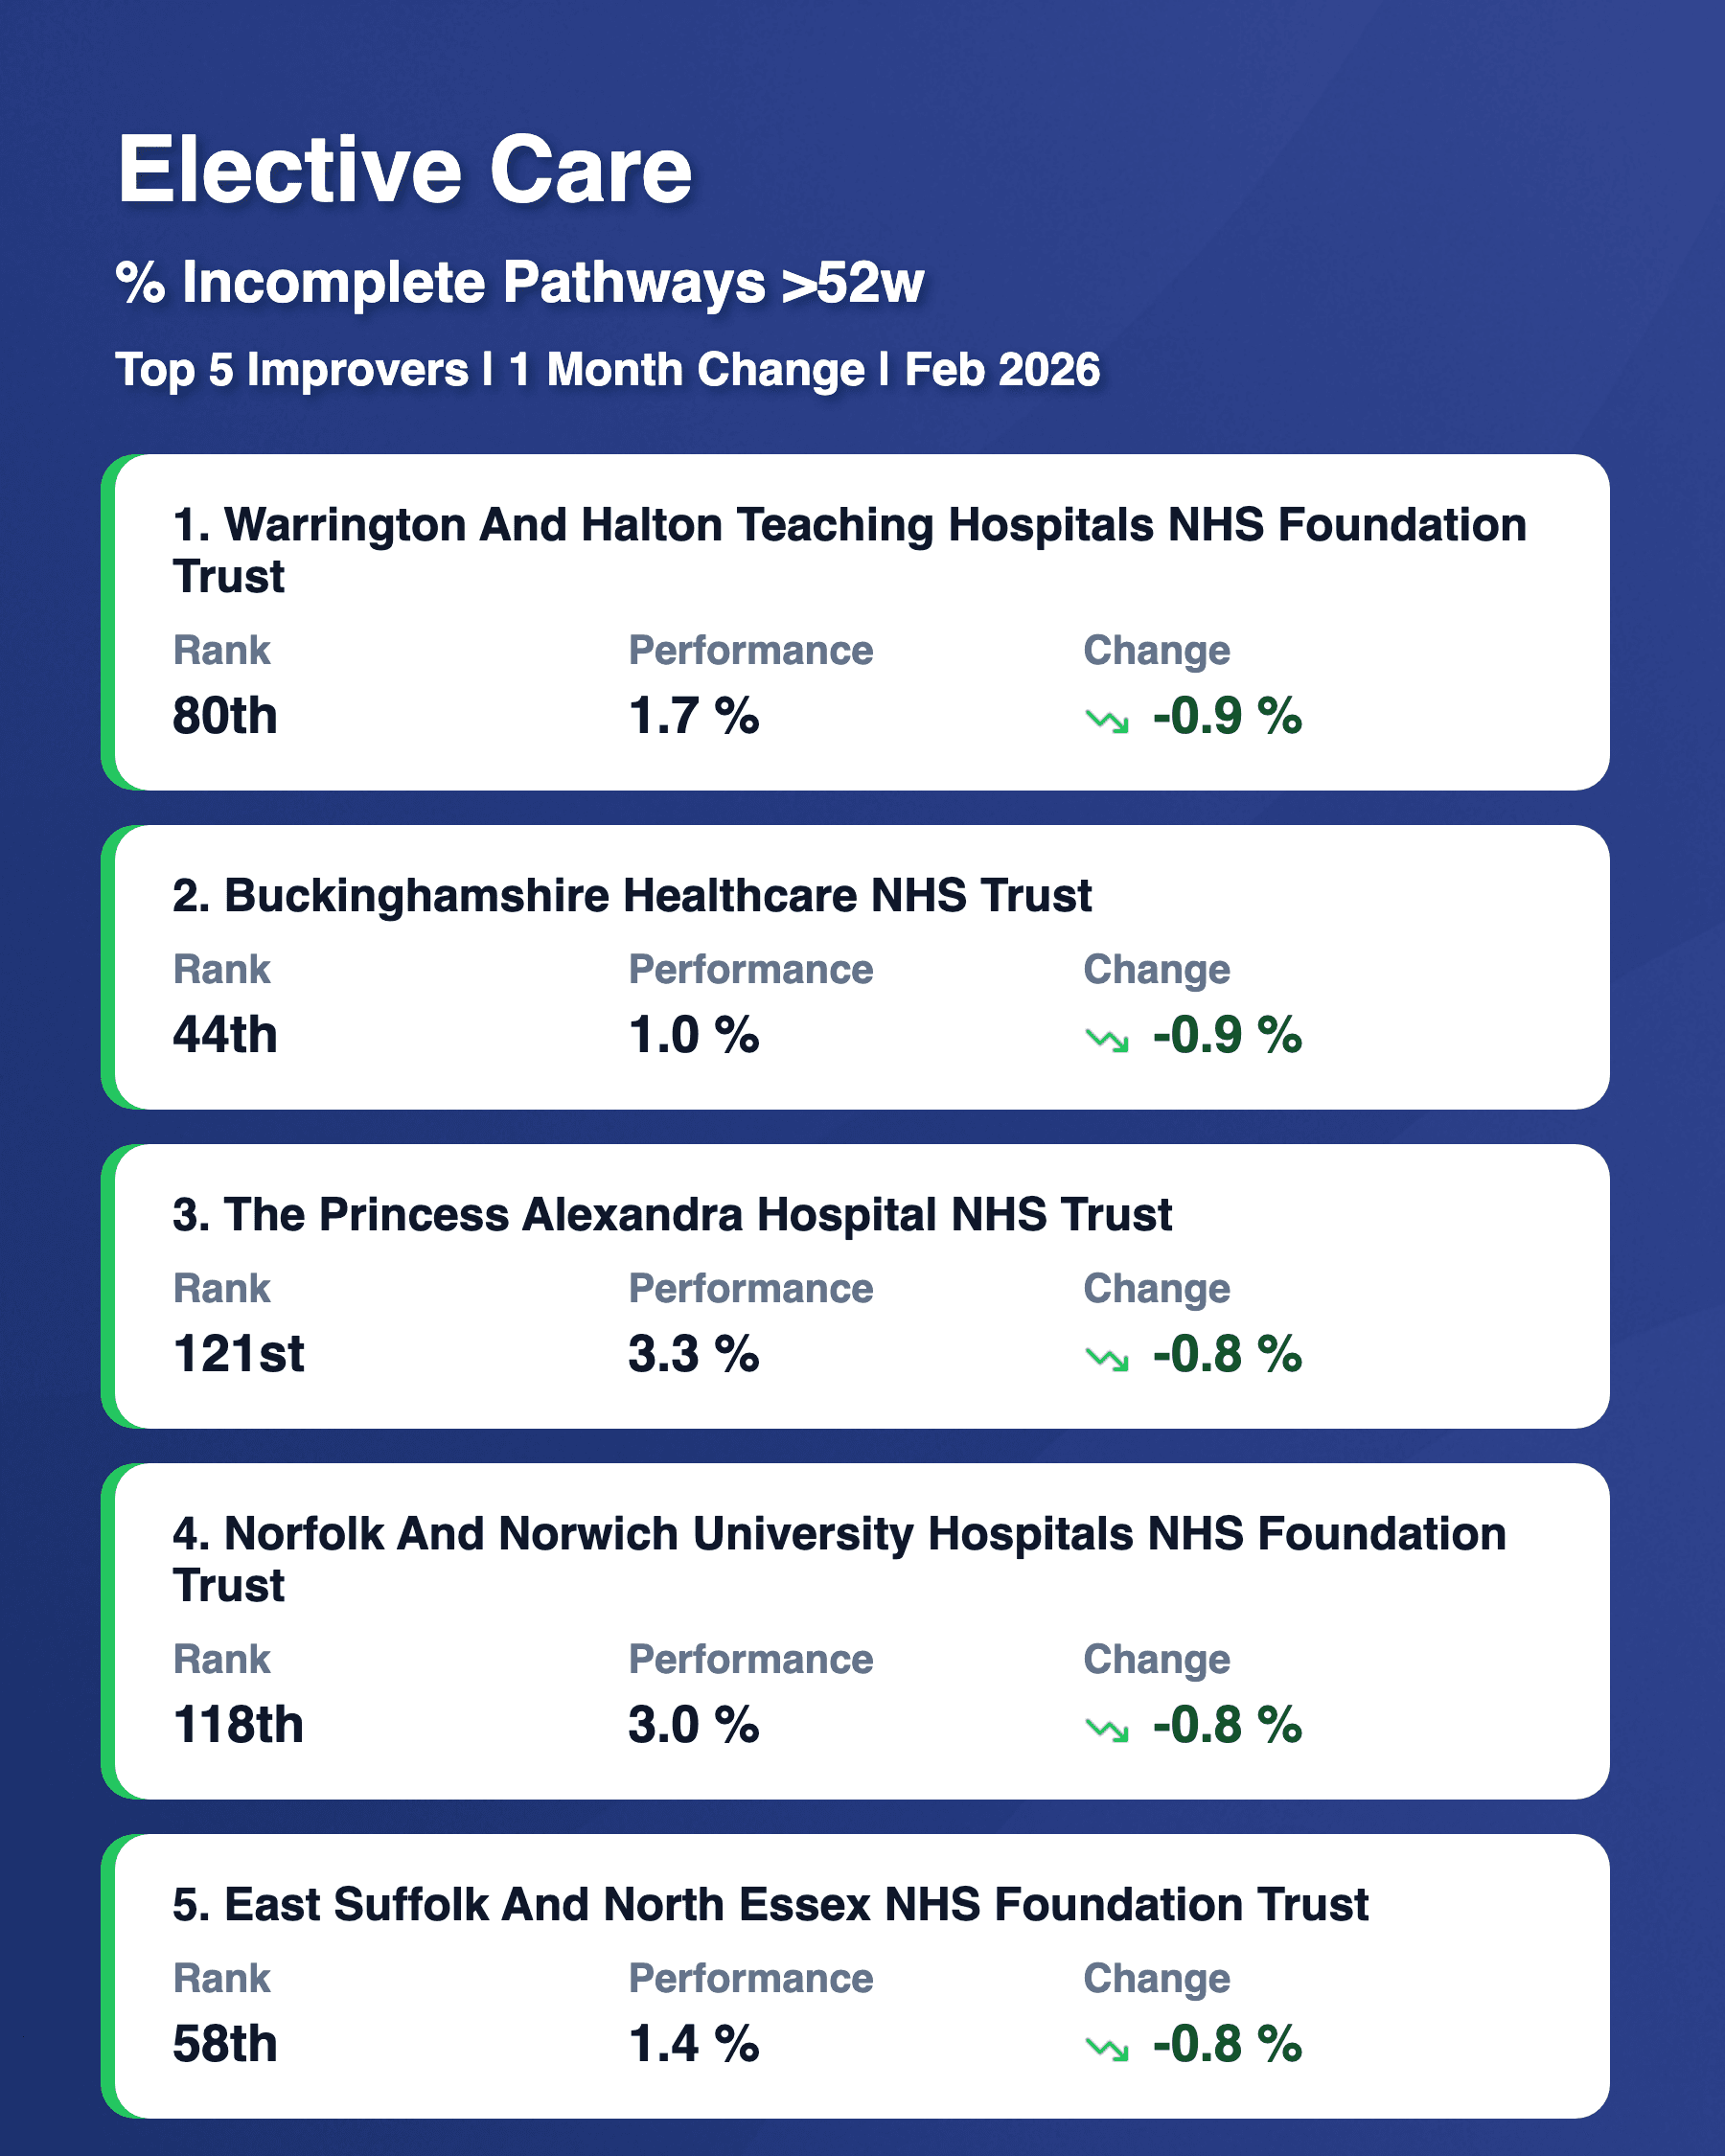
Top 5 Risers
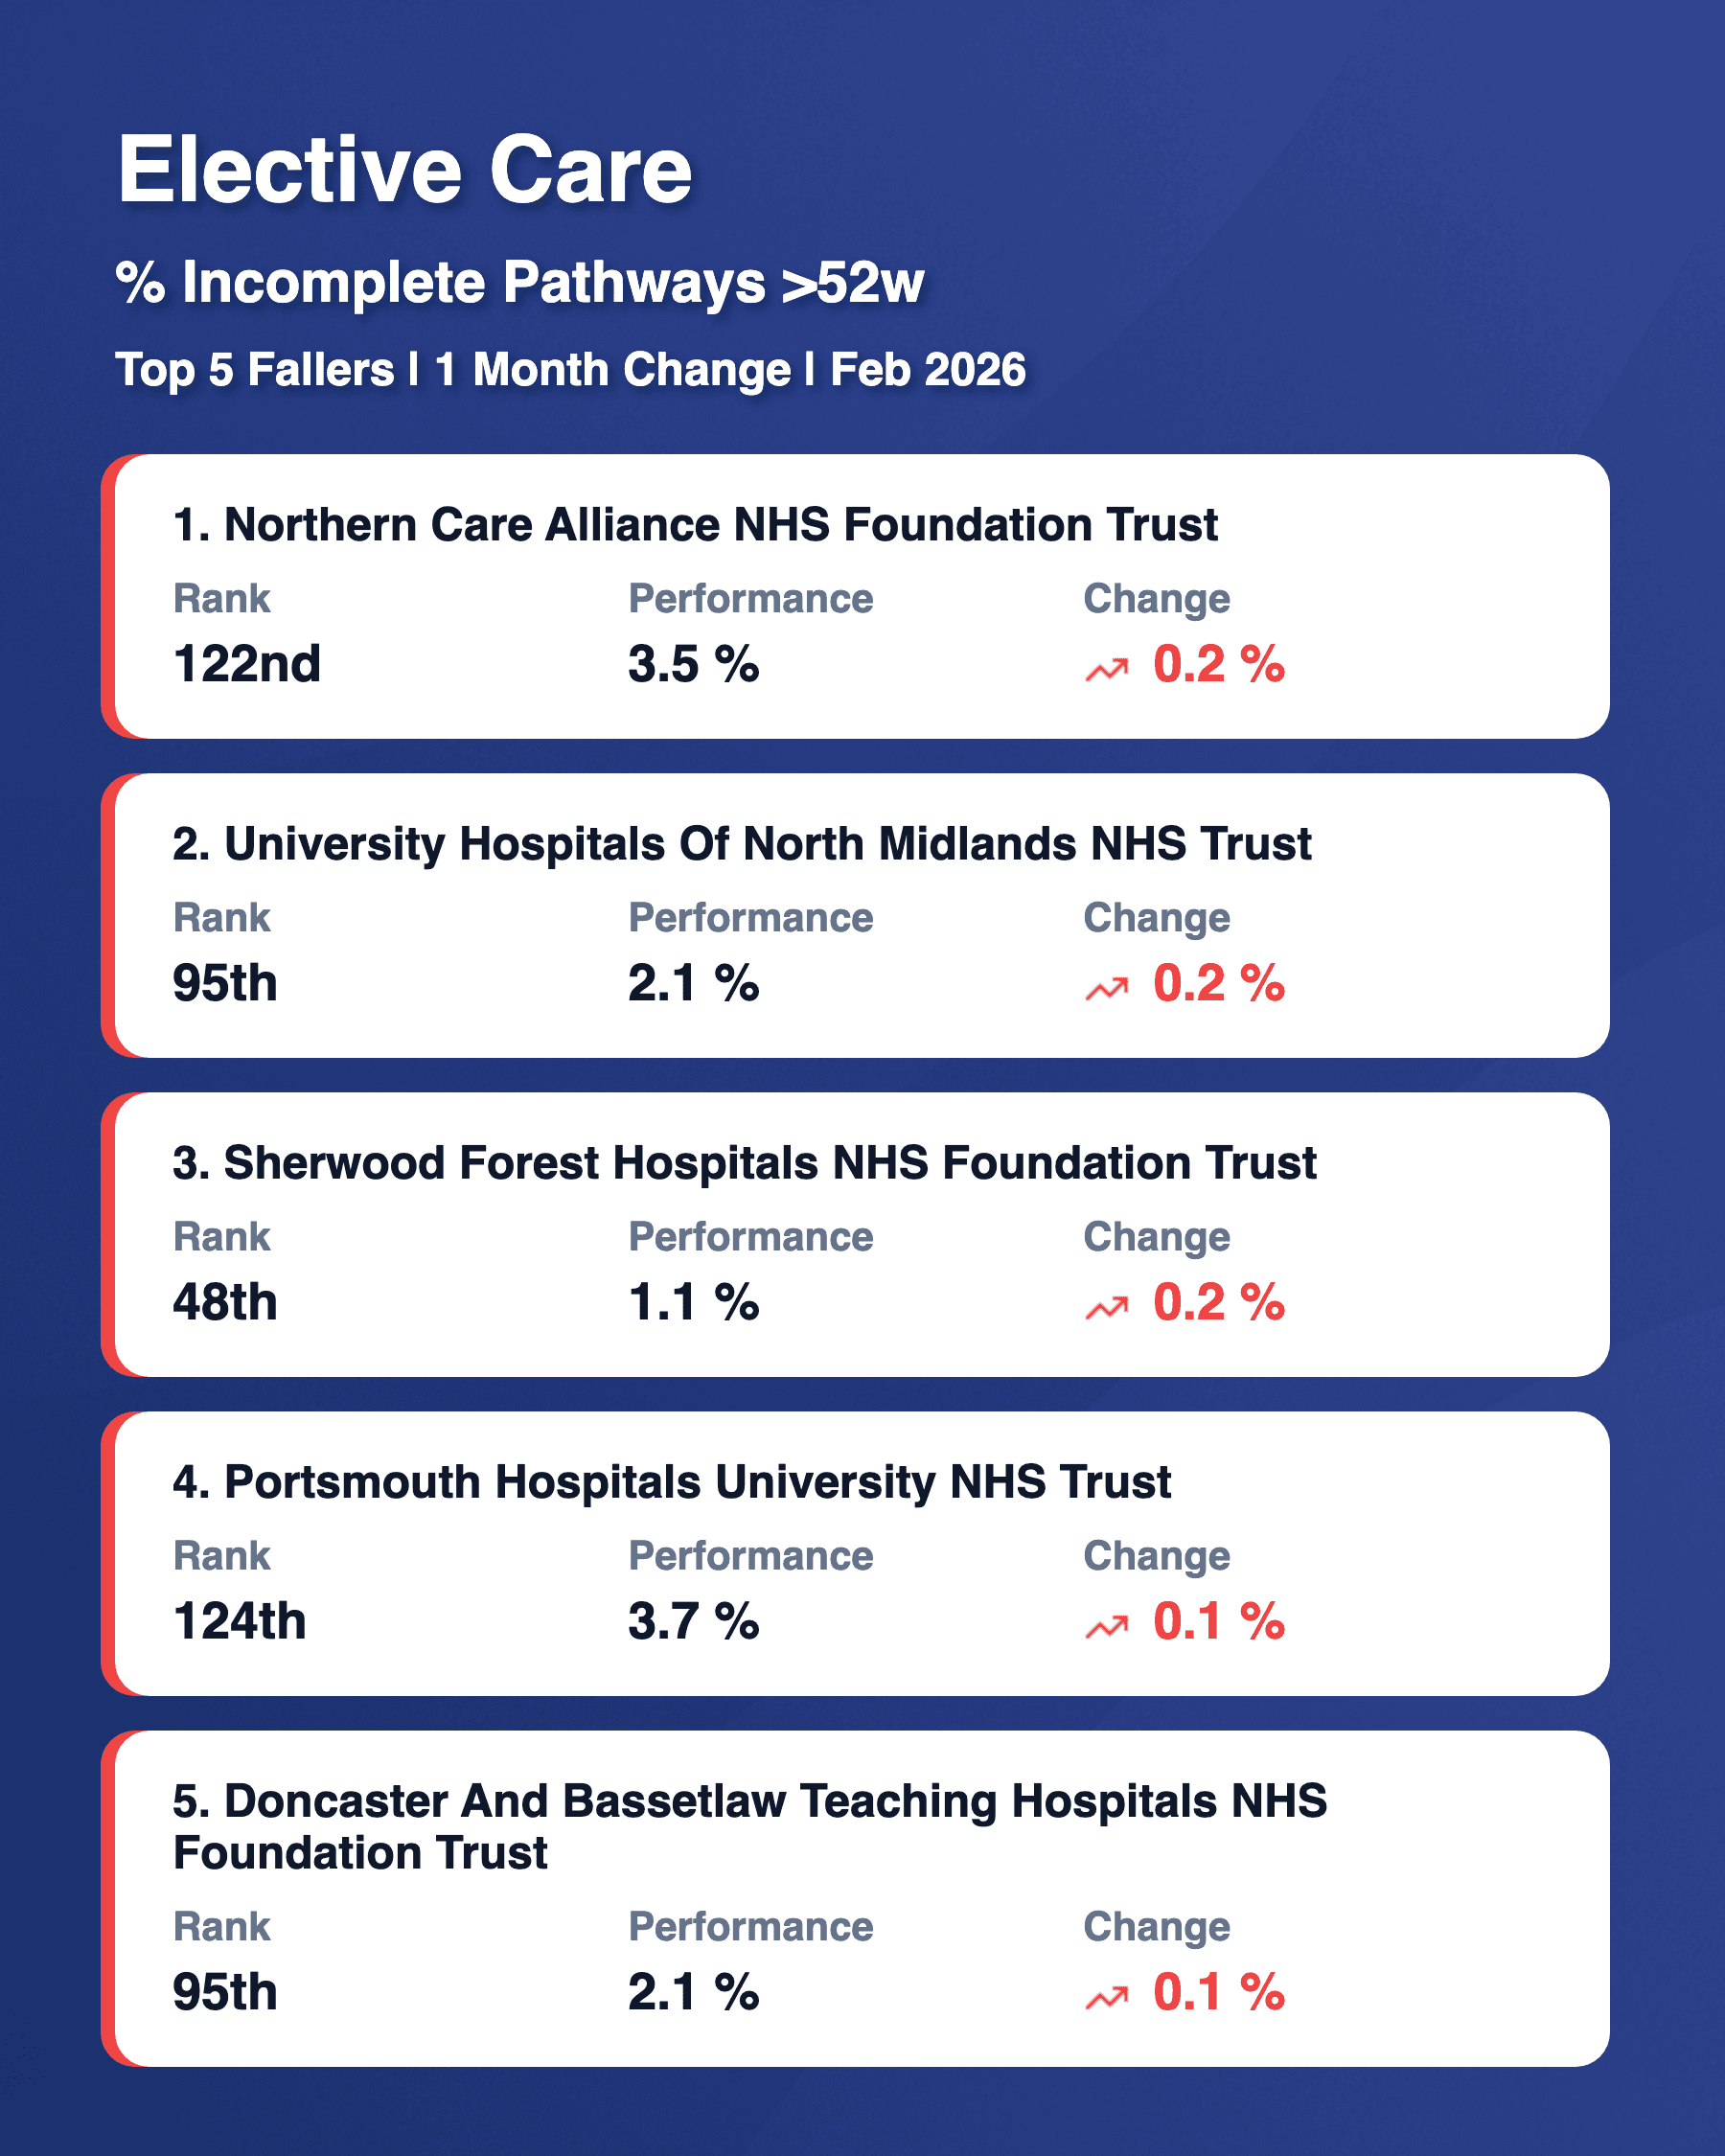
Top 5 Fallers
Create a free account today HealthcareBase.